如何写雅思折线图作文技巧
撰写雅思写作小作文(Task 1)中的折线图(line chart)作文时,遵循一定的结构和步骤可以帮助你更好地组织信息并有效地传达给读者。以下是关于如何写好雅思折线图作文的思路分析和写作示例。

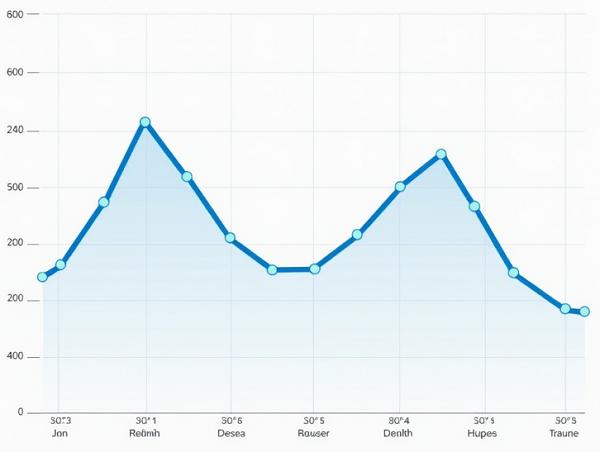
图片由AI生成,仅作为示例
写雅思折线图作文时,可以遵循以下步骤和技巧:
一、理解图表信息
阅读图表:在开始写作之前,仔细阅读图表,理解其中的关键数据和趋势。
注意细节:关注图表标题、坐标轴标签和单位,以及数据的变化趋势、高点和低点等。这些信息对于准确描述和解释图表至关重要。
二、构建文章结构
1、开头段
重新阐述题目中的信息,用不同的话描述图表所展示的内容。同时,可以简要提及将要讨论的主题或趋势。
2、主体段
概述段:概述图表总体的数据特征,不需要特别详细,只要写出主要趋势即可。
细节段:详细描述图表中各个主体的数据,尤其是那些有明显特征的数据点。如果图表中有多条线,可以分别描述每条线的趋势和特点,并进行比较。
·描述时,可以从总体、个体和比较三个角度进行观察。总体观察趋势,是上升还是下降,趋势是平缓的还是急剧的;个体观察最值,即波峰和波谷;比较观察相同和相反之处。
·使用适当的形容词和副词来描述数据的变化程度和速度,如“急剧上升”、“缓慢下降”等。
·注意句式的多样性,交替使用动词表达和名词表达。
3、结尾段
总结数据的主要趋势,并再次强调自己的观点或分析。可以提供一些展望或思考,以增加文章的深度。
三、运用写作技巧
分段清晰:将相同趋势的数据点放在同一段落中,使文章结构更加清晰。
简洁明了:在描述数据时,尽量简洁明了,不要冗长啰嗦。只需描述最重要的特征,如最高点、最低点和交点等。
使用连接词:在比较和对比数据时,使用适当的连接词来表达差异和联系,如“然而”、“相比之下”等。
结合数据给出观点:在主体段落中,可以结合数据给出自己的观点和分析。例如,解释数据背后的原因或影响,并提出可能的解决方案或预测。
四、范文示例
以下是一篇雅思折线图作文的范文示例:
The graph below shows the quantities of goods transported in the UK between 1974 and 2002 by four different modes of transport. Summarise the information by selecting and reporting the main features, and make comparisons where relevant.
The diagram illustrates the amount of goods transported by various means in the UK during the period from 1974 to 2002. It is evident from the line graph that roads undertaking the heaviest tasks of goods transportation throughout these years.
In 1974, 70 million tonnes of goods were transported by road. After a slight increase, the figure fell to a historic low of 66 million tonnes in 1980. Having experienced a steady growth and a temporary drop, the amount of goods transported by road rose steeply from 1996 and peaked at 99 million tonnes in 2002.
In contrast, pipelines accounted for the smallest transportation of goods. Merely 5 million tonnes were transported by this means in 1974. Since then, the amount kept increasing gradually and leveled off at 22 million tonnes in the late 1990s.
When it comes to rail and water transportation, both modes showed some fluctuations over the years. The amount of goods transported by rail increased initially, reached a peak in the mid-1980s, and then declined. Water transportation, on the other hand, experienced a steady growth until the mid-1990s, followed by a slight decline.
Overall, roads were the most dominant mode of transport for goods in the UK between 1974 and 2002. with a significant increase in the amount of goods transported over time. Pipelines, on the other hand, played a relatively minor role in goods transportation.
这篇范文清晰地描述了图表中的数据,并进行了适当的比较和分析。同时,文章结构清晰,分段明确,句式多样,符合雅思折线图作文的写作要求。
通过上述步骤和技巧,你可以更加系统地准备并完成雅思写作小作文中的折线图描述。记住,练习是提高写作能力的关键,多做一些模拟练习可以帮助你更好地掌握这一技能。


